
Making waves
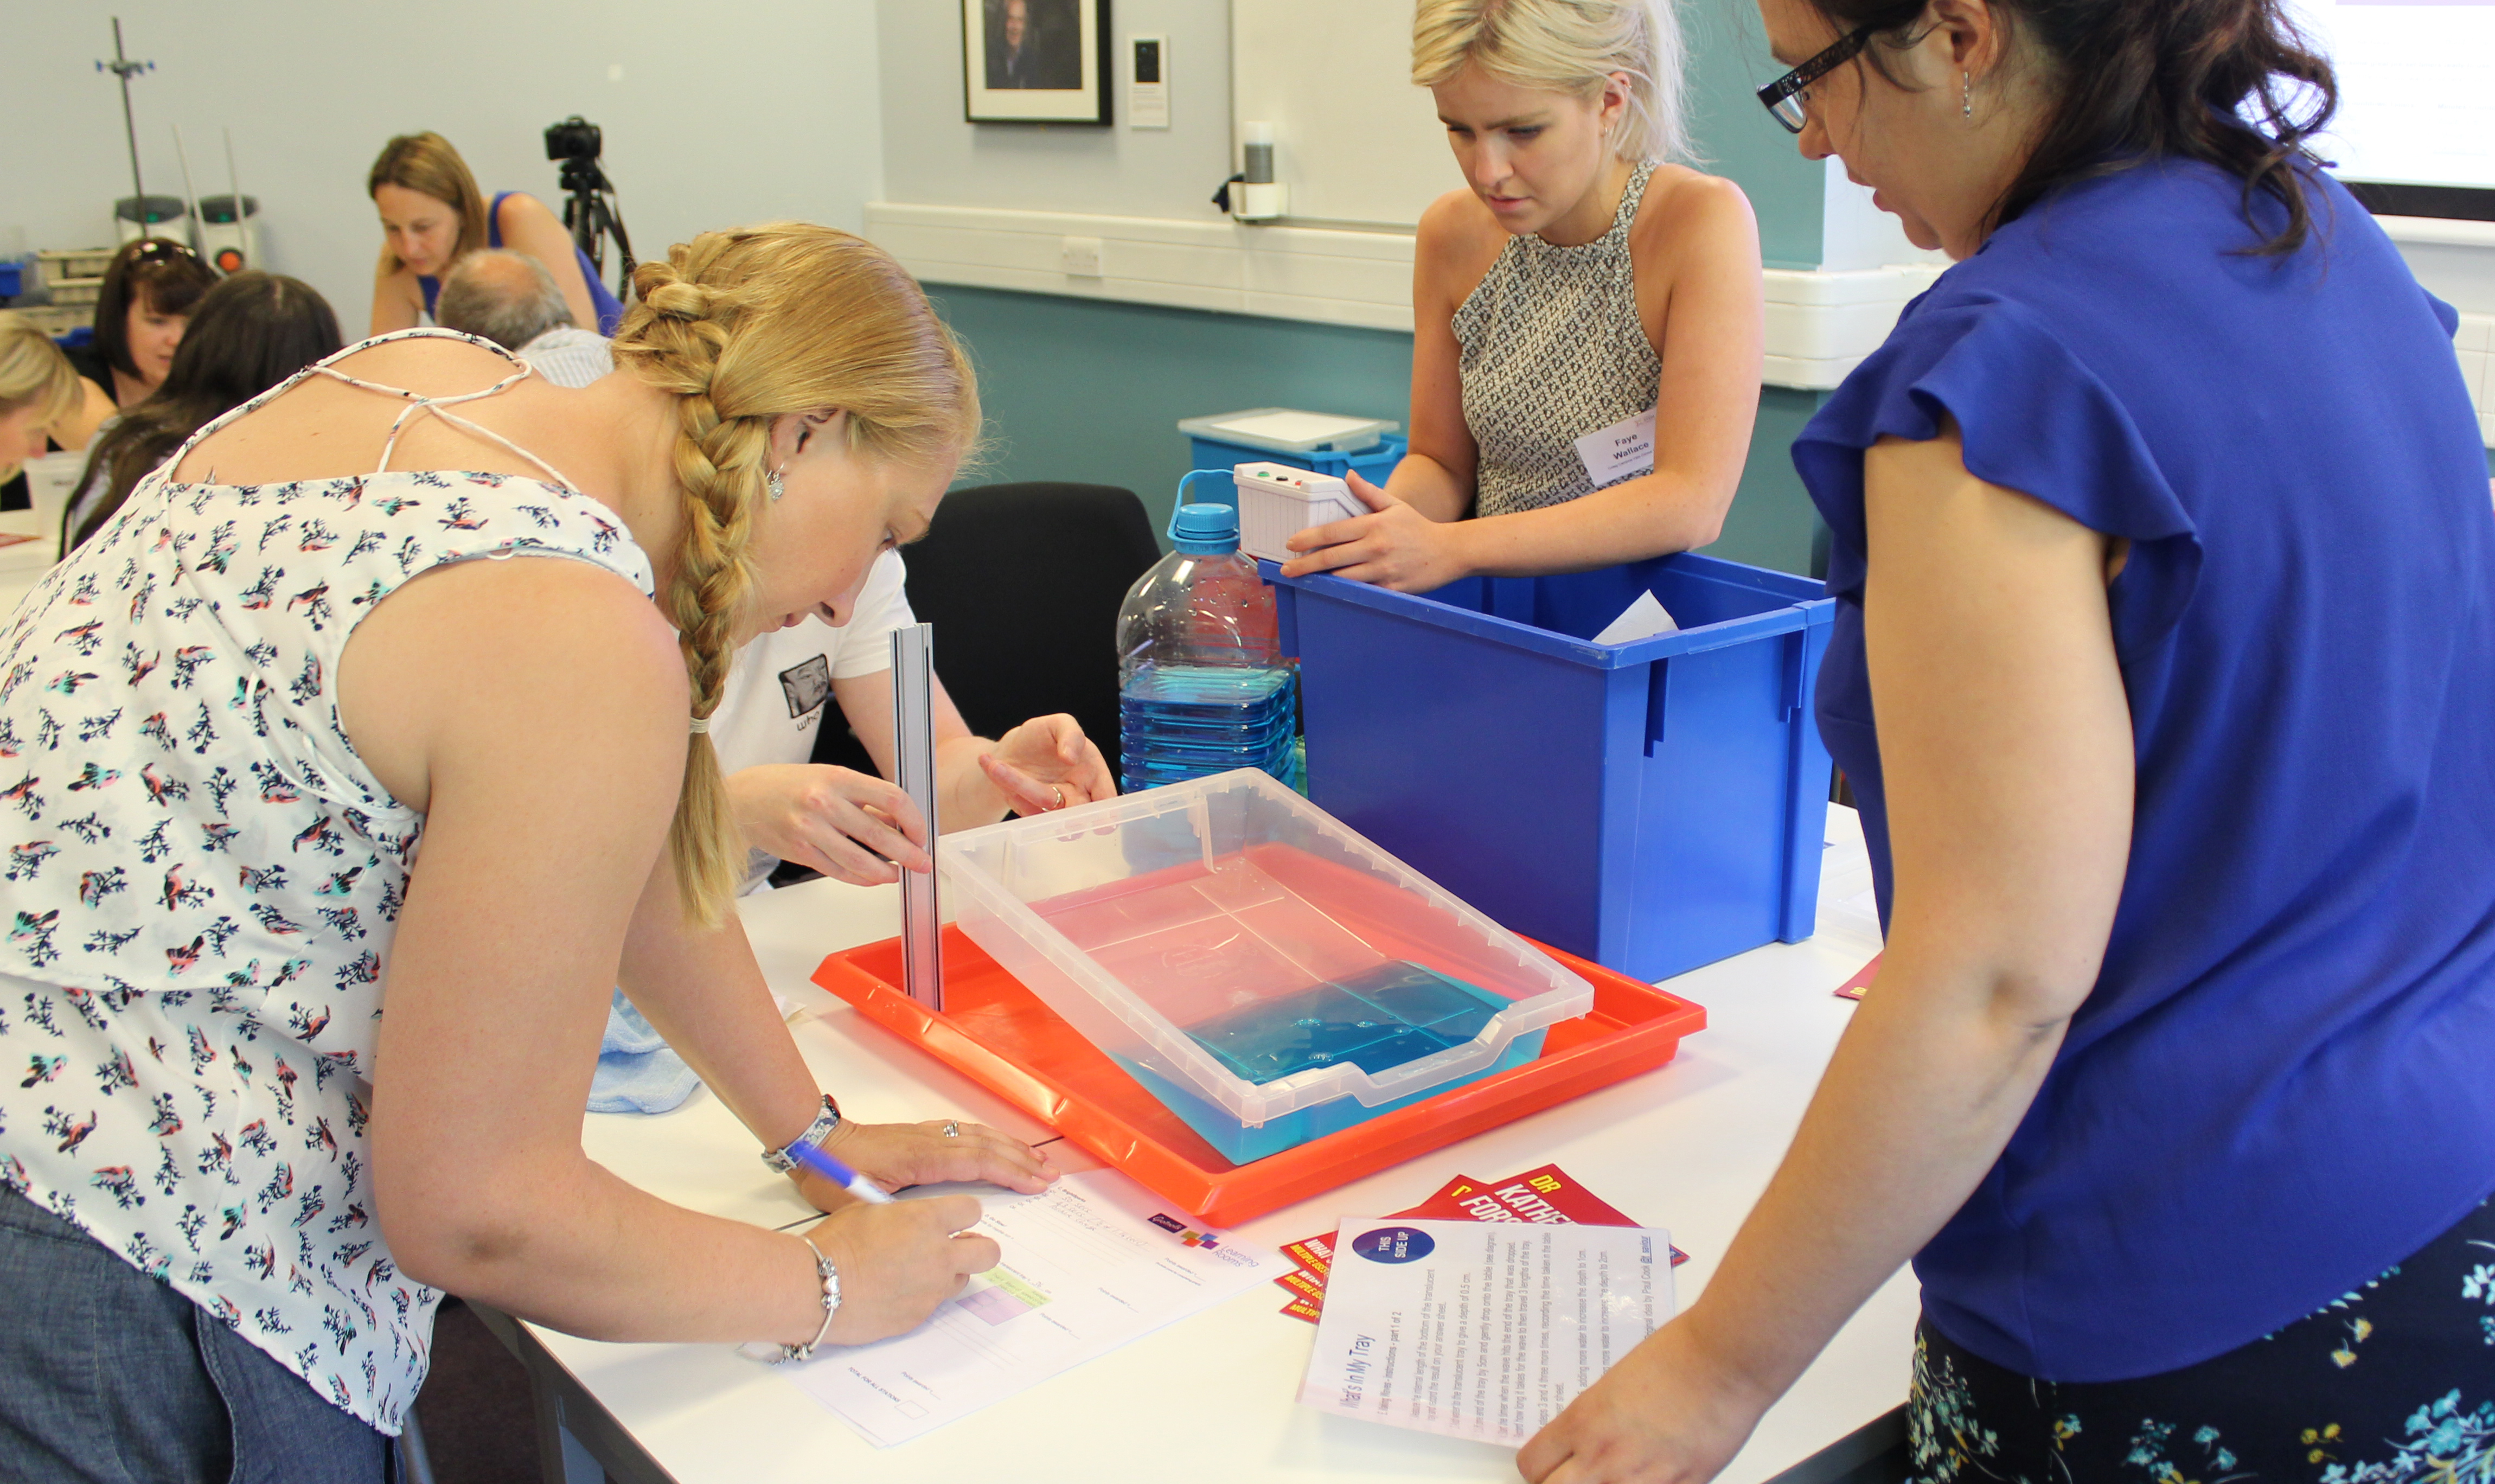
This activity was created as part of a Gratnells What’s In My Tray CPD workshop for secondary science technicians to support practical work and delivery of the curriculum. It can be carried out as a stand-alone activity for students or combined with other activities from the session to form a STEM carousel.
Based on an original idea by Paul Cook, Gratnells Science Technician of the Year Runner-Up 2017.
Learning outcomes
You will be able to:
- Set up a wave chamber and use it measure surface wave speeds
- Investigate and describe how surface wave speed changes with water depth
- Record your data and plot it on an appropriate graph
You will need (per team of 4):
- 1 x Shallow translucent Gratnells (F1) tray
- 1 x Extra deep Gratnells tray with lid
- 1 x Gratnells art tray
- 1 x Metal ruler (or any other ruler that measures from the end of the ruler)
- 1 x Metal tape measure ~5m long
- 2 x Microfibre/very absorbent cloths
- Paper towels as a backup in case of spills
- 4 litres of tap water
- A few drops of blue food colouring
- 2 x Measuring jug or a bottle with lid ~2 litre capacity each
- 1 x Large funnel
- 1 x Stopwatch
- 2 x Calculator
This activity also works for teams of 2 or 3 people, just increase the amount of time allocated to complete it.
Preparation:
- Make up the 4 litres of coloured tap water by adding a few drops of blue food colouring to the tap water split between two jugs or bottles that are small enough to fit inside the extra deep tray.
- Place all the equipment into the extra deep tray and put the lid on.
- Place the translucent tray into the art tray, the art tray is there to catch any drips or spills.
What to do:
- Measure the internal length of the bottom of the translucent tray and record the result.
- Add water to the translucent tray to give a depth of 0.5 cm.
- Lift one end of the tray by 5 cm and gently drop onto the table (see diagram).
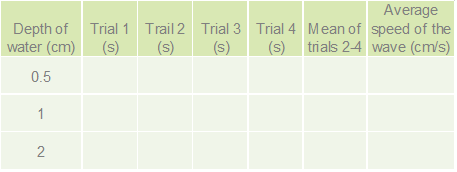
- Start the stopwatch when the wave hits the end of the tray that was dropped. Record in the table provided, how long it takes for the wave to then travel three lengths of the tray.
- Repeat steps 3 and 4 three more times, recording the time taken in the table provided.
- Repeat steps 2 to 5, adding more water to increase the water depth to 1 cm.
- Repeat steps 2 to 5, adding more water to increase the water depth to 2 cm.

AVOID SLIPS – Please wipe up any spills as they happen.
Keep the translucent tray in the large tray while carrying out your investigation to contain any drips or spills. When tidying up, carefully return all the water to the jugs/bottles with the aid of the funnel.
Internal length of the bottom of the translucent tray = cm
Answer the following questions:
- What happens to the speed of the wave as the depth of the water increases?
- Why?
- Why was it useful to perform multiple repeats at each water depth?
Answers:
- The speed of the wave increases as the depth of the water increases.
- The water depth is less than the size of the wave so the wave is slowed down by friction from the bottom. Aka frictional drag. As water depth increases, more of the wave is moving water over water, with much less friction between layers and so speed is greater.
- To increase the accuracy of the data. The first trial is just to help get used to the method, so by taking the mean of trails 2-4 we are discounting the first and ensuring the most accurate possible results.
Tip: It also helps if the same person operates the stopwatch for each test, as this removes another potential variable.
Other things to try…
- Plot a graph of the data you have recorded, it will make it easier to spot any patterns. What pattern have you observed?
- Repeat the activity but this time using an A3 Gratnells tray in place of the shallow translucent (F1) tray. Does a wider and longer tray effect the speed of the surface wave? Collect data and plot it on a graph, compare the data to that obtained from the shallow (F1) tray.
- Use a deep (F2) Gratnells tray for the activity, it has the same internal length but is deeper, so you could try out a larger range of water depths and see if the pattern you observed in the first activity continues. Plot this data on the same graph. Compare the results with your other tests.
- Cover the bottom of the tray with a thin layer of fine gravel or grit and repeating the tests. Can you predict what effect this will have? Why? Plot this data on the same graph. Compare the results with your other tests.
For more images and videos of this activity taken at the National Technicians Conference in York see here.
Health & Safety
As with all Gratnells Learning Rooms What’s In My Tray activities, you should carry out your own risk assessment prior to undertaking any of the activities or demonstrations. In particular for this activity, you should consider all risks associated with working with water.